
Setup Sensor
So to start where I left off last week, I need to use an actual sensor. To get myself started, I pulled out the TCS34725 RGB sensor I used in Understanding Networks last semester. It communicates over I2C, so I connected the sensor to my Arduino Nano as follows:
Arduino Nano 33 IoT
5V
GND
SDA
SCL
TCS34725
VIN
GND
SDA
SCL


Once the sensor was connected correctly I ran the “tcs34725.ino” example from Adafruit’s library to double-check my circuit. Looks like it works! Also, I noticed as I was getting this sensor setup that this product has been discontinued by Adafruit, so I might consider using a different sensor for this or future projects.
Integrate with TCP Client Example
Port the “tcs34725.ino” example to Tom’s “WiFiTCPClientLogger.ino” example from last week. I was able to get my sensor readings to send over the sandbox370 network and they were received by netcat application listening on port 8080. But what is super weird is that the RGB readings are totally wrong, like nowhere close to the data I saw running the library example. At first I thought the issue may be caused by concatenating the message or the replace() function but below is my debugging, and even the raw data from the library is wonky. I’ll have to come back to this tomorrow.
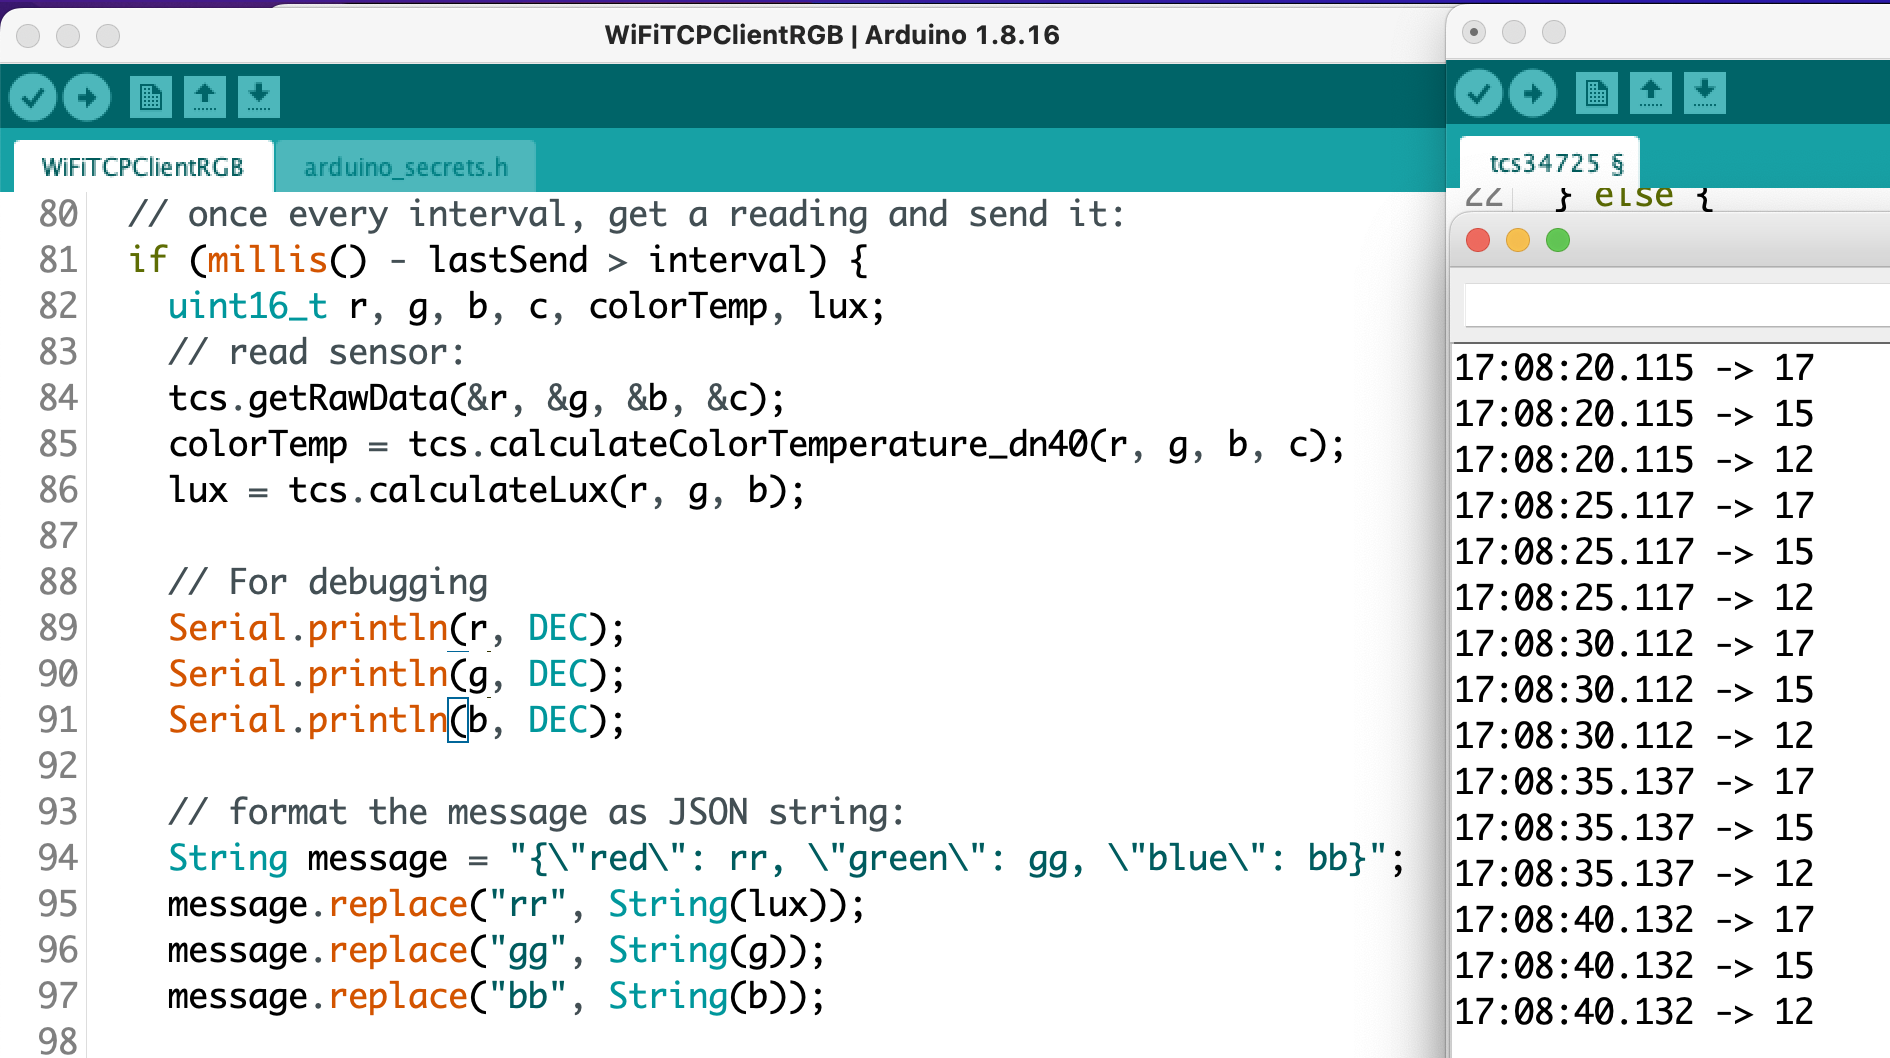

Ok, I looked at this the day after running into this bug and turns out if you want the sensor output to look the same between different sketches you need to remember to initialize it with the same parameters (🤦♀️). This output looks a lot better!
Get sensor data onto web page
Now I needed to save my sensor data to a .json file. I followed the tutorial and ran “nc -l 8080 | tee log.json” in my terminal window. I could see something was happening because using the “tee” command I could see the sensor data on the terminal itself. But where is my log.json file? I looked at a couple of other people’s blog posts and found that my file is here:

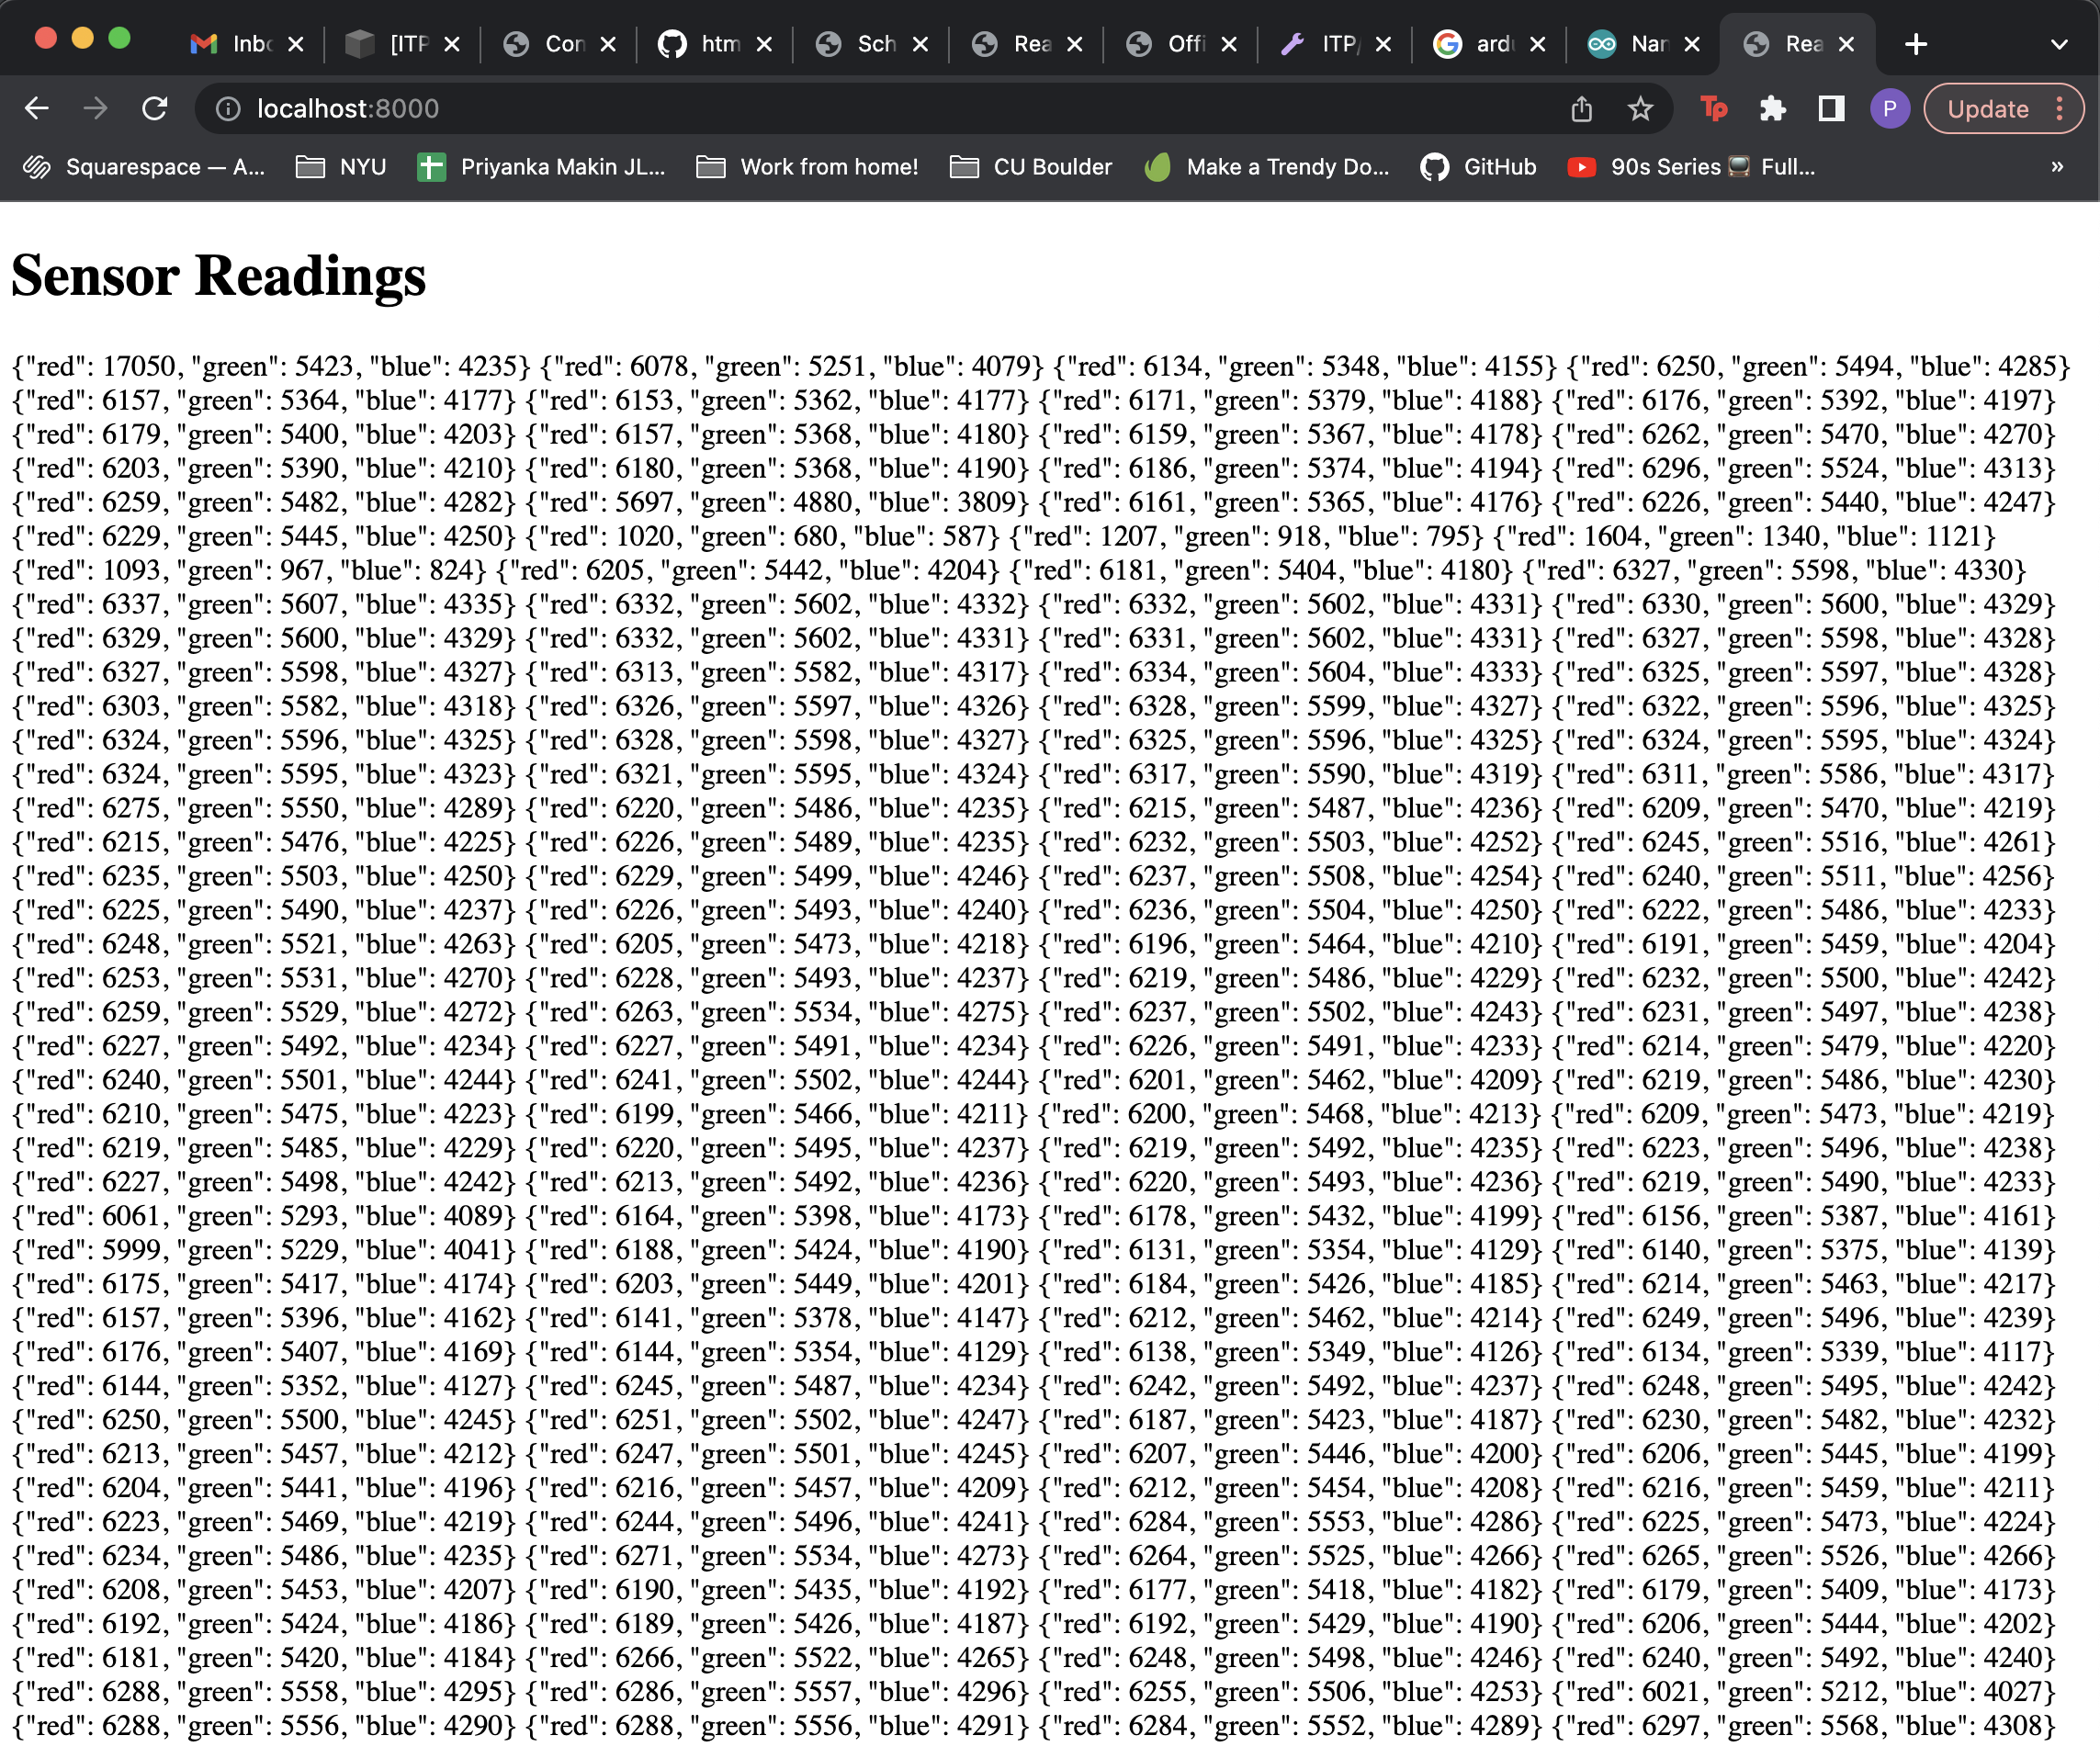
Which totally makes sense because in the terminal we are working in my user’s root directory. I followed the tutorial’s directions to run the sketch, navigate to the sketch directory (with index.html, script.js) and using Fetch to read the file. Typing “nc -l 8080 >> log.json & python3 -m http.server” in the terminal starts the server and then you can see the data coming in!
For a continuation of this project, please see my next blog post.
Resources
https://tigoe.github.io/html-for-conndev/DeviceDataDashboard/